Imagery for importing into Google Earth
[West Australia, last 6 days] [daily 2008-now]
[East Australia, last 6 days] [daily 2008-now]
[SE Australia H8, last 6 days at 4h intervals] [daily 2018 H8]
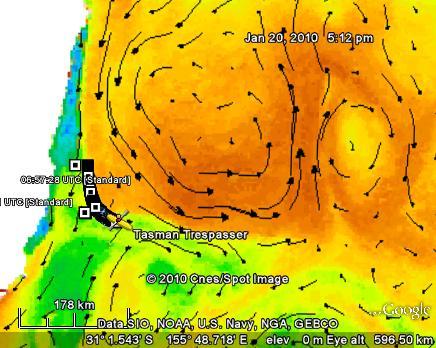
Click one of these links to make a map of the anomaly of 3-day average SST for WA or East Australia appear in Google Earth. If you select the 'last 6 days' link, drag the time slider right to see the most recent data. For either recent or old, zoom in to see 1-day composite images of SST anomaly, overlain with altimeter-derived estimates of currents.
This RV Investigator track and ADCP data kml file shows the current velocity averaged from 30m-80m.
<< Example Google Earth screen-grab
The Example shows the track [source] of ocean kayaker Shaun Quincy just two days into his voyage from Australia to New Zealand, overlain on our near-real-time ocean analysis.
